 Dividends Inside
 Market Analysis Through 2026-08-17: QQQ Leads SPY While Gold Holds Firm and Bitcoin Data Lags
A dated market review of SPY, QQQ, Bitcoin, gold, and the largest recent ticker moves in the supplied database observations.
This market review uses only the supplied database observations. The equity ETF observations for SPY and QQQ are dated 2026-08-17. The gold futures observation for GC=F is dated 2026-08-16. The Bitcoin-related observation for BTC, the Grayscale Bitcoin Mini Trust ETF page in this database, is dated 2026-06-02, so it should be read as older database history rather than a same-date cross-asset quote.
The goal is not to predict returns. A dated market snapshot is more useful when it separates short-term movement from broader context, compares leadership across assets, and flags unusual data points that deserve follow-up research. For dividend and income investors, broad market tone can be a backdrop for watchlist review, but it should not replace security-level work on cash flow, payout policy, valuation, and portfolio role.
Equity Benchmarks
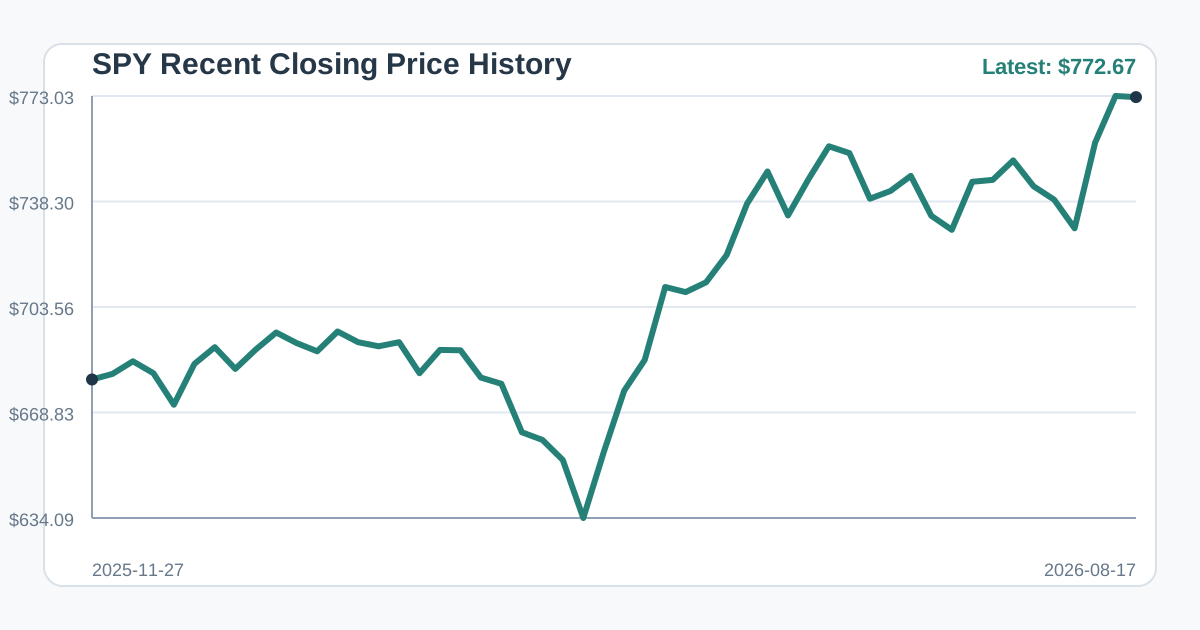
SPY, the SPDR S&P 500 ETF Trust, had a latest supplied database close of $772.67 on 2026-08-17. Its one-session move was -0.47%, its five-session change was -0.05%, and its 21-session change was +4.67%. That combination describes a market that had gained over the trailing 21-session window but had stalled over the most recent week in the supplied data. The one-session decline was modest in percentage terms, but it did leave SPY slightly negative over five sessions.
The SPY chart shows closing prices from 2025-11-27 through 2026-08-17, ending at the supplied latest close of $772.67. It is useful here because it places the small one-session decline and nearly flat five-session change inside a longer price path, which helps avoid overinterpreting a single daily move.
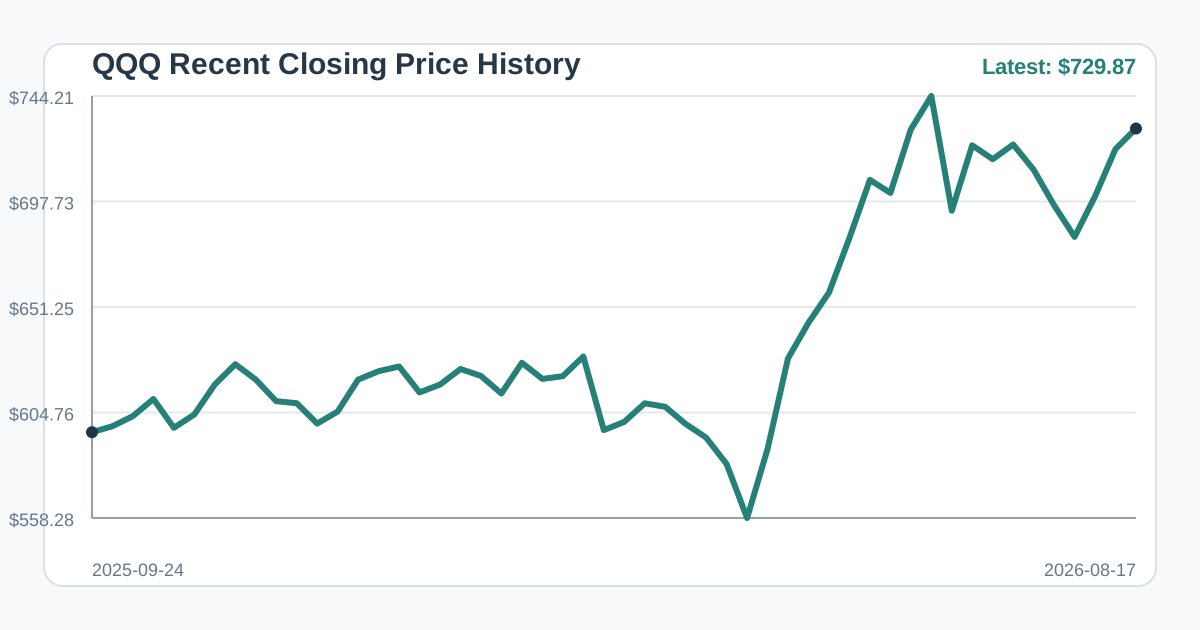
QQQ, the Invesco QQQ Trust, Series 1, had a latest supplied database close of $729.87 on 2026-08-17. Its one-session move was -0.16%, its five-session change was +1.25%, and its 21-session change was +4.97%. Compared with SPY, QQQ held up better over both the latest session and the latest five sessions in the supplied observations. Its 21-session gain was also slightly stronger than SPY's.
The QQQ chart covers closing prices from 2025-09-24 through 2026-08-17, with the latest plotted close at $729.87. In this article, the chart is a research aid for comparing trend and volatility context against SPY, not a recommendation to use QQQ as a holding.
The difference between SPY and QQQ matters because these two ETFs often represent different equity exposures. SPY is a broad large-cap benchmark, while QQQ is more concentrated in Nasdaq-100 constituents and often reflects heavier exposure to growth-oriented sectors. In the supplied data, QQQ's relative strength over one, five, and 21 sessions suggests that market leadership leaned toward the growth-heavy benchmark through 2026-08-17. That does not mean risk appetite was uniformly strong; it means the supplied observations show QQQ outperforming SPY over the measured windows.
For readers building an income-focused watchlist, broad benchmarks can be useful reference points rather than portfolio instructions. A high-growth benchmark can rise while dividend sectors lag, and a dividend ETF can look attractive on yield while carrying its own sector or strategy concentration. Tools such as the Stock screener and the ETF dividend yield screen can help compare yield, type, valuation, and sector characteristics after the market backdrop is understood.
Bitcoin And Gold
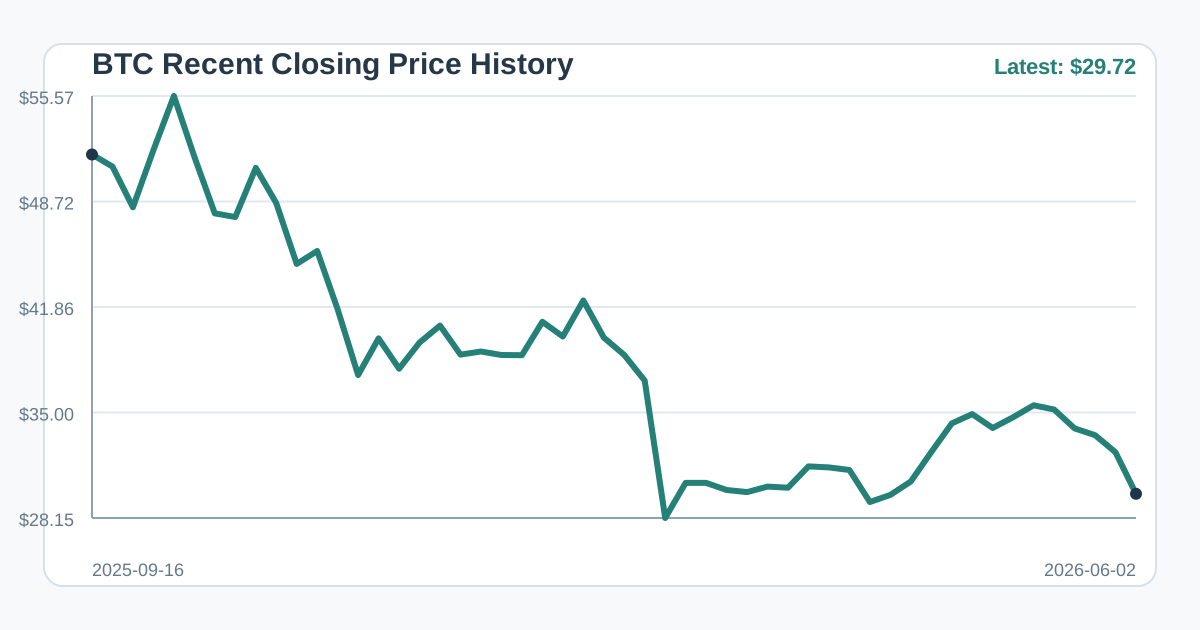
The supplied Bitcoin-related observation is for BTC, identified here as the Grayscale Bitcoin Mini Trust ETF page in the database. Its latest supplied database close was $29.72 on 2026-06-02, with a one-session move of -5.98%, a five-session move of -8.33%, and a 21-session move of -16.84%. Because this observation date is much older than the 2026-08-17 equity benchmark observations, it should not be treated as a direct same-day comparison against SPY or QQQ.
The BTC chart shows closing prices from 2025-09-16 through 2026-06-02, ending at the supplied latest close of $29.72. Its relevance is mainly historical within this database extract: it shows that the latest available BTC series had weakened sharply by its own latest observation date, but it does not establish Bitcoin's position on 2026-08-17.
This timing difference is an important data-quality lesson. Cross-asset analysis depends on aligned observation dates. If one series ends in June and another ends in August, the older series can still be discussed, but it should be labeled clearly. In this case, the BTC data shows a negative one-session, five-session, and 21-session pattern as of 2026-06-02. It should not be used to infer risk appetite on 2026-08-17 without additional, same-date data.
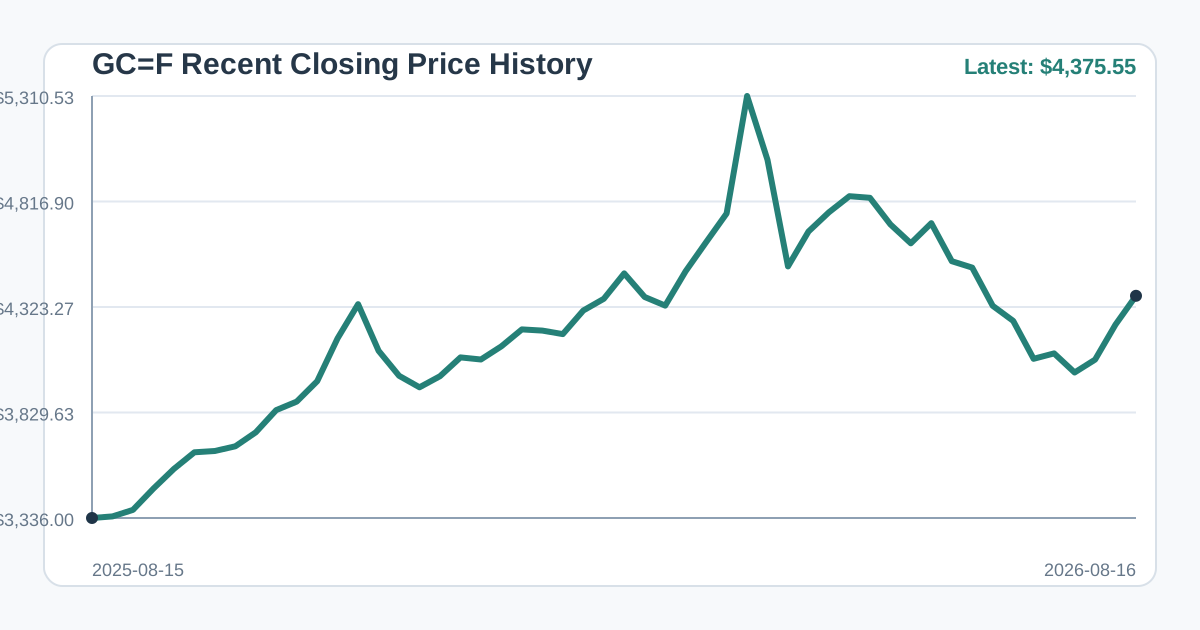
Gold, represented by GC=F, had a latest supplied database close of $4,375.55 on 2026-08-16. Its one-session move was -0.02%, its five-session change was +3.18%, and its 21-session change was +4.80%. The one-session move was essentially flat, while the five-session and 21-session changes were positive. Compared with SPY and QQQ, gold's five-session gain was stronger than both equity benchmarks in the supplied observations. Its 21-session gain was close to QQQ and slightly above SPY.
The GC=F chart covers closing prices from 2025-08-15 through 2026-08-16, with the latest plotted close at $4,375.55. It is included here to show the price path behind gold's positive five-session and 21-session changes, especially because gold's latest observation date differs by one day from the SPY and QQQ observations.
Gold's relative firmness alongside QQQ's leadership gives a mixed cross-asset message. Growth-heavy equities showed leadership within the equity benchmarks, while gold also held a strong five-session profile. That combination can appear when investors are willing to own risk assets but still value defensive or inflation-sensitive exposure. The supplied data does not prove why the moves occurred; it only shows that leadership was not confined to one side of the risk spectrum.
Largest Recent Moves
The largest one-session moves in the supplied historical_prices observations are mostly small-price securities, rights, acquisition-related instruments, or micro-cap names. That matters because percentage changes can become extreme when the base price is very low. A move from $0.08 to $0.10 is a 25% gain, but the absolute price change is only two cents. These names are better treated as research leads than as clean signals about the broad market.
The largest listed move was MYSEW, shown as +200.00% from 2026-08-13 to 2026-08-14, with prices displayed as $0.00 to $0.00. That combination should immediately raise a data-quality question. A 200% percentage change paired with rounded zero-dollar prices may reflect very small unrounded prices, a feed issue, a security-specific event, or another data anomaly. Before drawing any conclusion, a researcher would want to check corporate actions, symbol details, and raw price precision.
TTOO, T2 Biosystems, Inc., showed a -50.00% move from 2026-08-14 to 2026-08-17, also displayed as $0.00 to $0.00. Like MYSEW, the rounded price display makes the percentage move hard to interpret without more detail. Large percentage moves at near-zero displayed prices should not be read the same way as large moves in liquid, higher-priced securities.
Several of the largest movers were rights or acquisition-related securities. BEAGR fell -27.68% from $0.33 to $0.24 between 2026-08-07 and 2026-08-17. DMIIR rose +24.75% from $0.08 to $0.10 between 2026-08-14 and 2026-08-17. AMPGZ rose +23.04% from $0.33 to $0.40 over the same dates, while APACR fell -19.90% from $0.10 to $0.08. These instruments can behave differently from ordinary common stocks because their value may depend on deal structure, redemption mechanics, expiration terms, liquidity, or corporate events.
Other notable supplied moves included BPTH, down -23.50% from $0.04 to $0.03 between 2026-08-14 and 2026-08-17; GENVR, down -20.83% from $3.60 to $2.85 between 2026-08-16 and 2026-08-17; QSEAR, up +19.79% from $0.21 to $0.25 between 2026-08-07 and 2026-08-17; and PLYX, down -19.23% from $2.60 to $2.10 between 2026-08-14 and 2026-08-17. These are large percentage changes, but their research value depends on confirming the instrument type, liquidity, news, and whether any split, merger, redemption, or data adjustment affected the series.
A practical workflow is to separate broad-market signals from idiosyncratic move lists. SPY and QQQ help frame large-cap equity tone. Gold helps show whether defensive or alternative assets were also firm. BTC can be reviewed only through its supplied 2026-06-02 database date. The large-mover list, by contrast, is mainly a queue for deeper checks. Investors can use Dividend stock lists or the Stock forecast planner to continue structured research, but the first step with unusual movers is usually verification rather than interpretation.
Research Takeaways
Through the supplied 2026-08-17 equity observations, QQQ showed stronger short-term leadership than SPY: down less over one session, up over five sessions, and ahead over 21 sessions. SPY remained positive over 21 sessions but was roughly flat over five sessions. Gold, with a latest supplied observation on 2026-08-16, was nearly unchanged over one session but stronger over five sessions and positive over 21 sessions. BTC's latest supplied database observation was 2026-06-02, and it showed weakness through that older date rather than a fresh August comparison.
For dividend-focused readers, the main lesson is process. Market leadership can help organize the research backdrop, but income planning still requires security-level review. Broad ETFs such as SPY, QQQ, VOO, or IVV can be useful benchmark examples, while dividend tools such as the DRIP calculator can help compare reinvestment assumptions. None of those examples are recommendations; they are starting points for disciplined, dated research.