Account
Dividend tracking that starts with lots
Track buys and sells at lot level so holdings, yield, dividend totals, and portfolio history stay tied to real transactions.
A shareable overview for anyone who wants to understand the product before signing up: portfolio tracking, dividend income views, ticker research, imports, forecasts, and DRIP comparisons.
Public tools can be opened without an account. Saving portfolios and lots requires signing in.
These are the same product capabilities promoted on the public homepage.
Track buys and sells at lot level so holdings, yield, dividend totals, and portfolio history stay tied to real transactions.
Review how a ticker performs inside your portfolios instead of only seeing one flat account-level number.
Follow income, yield on cost, dividend history, and calendar events, then export timing data to your own calendar as `.ics`.
Find securities quickly with search that works for ticker symbols, company names, and ISIN codes.
Try stock planning, dividend growth scenarios, and reinvestment comparisons before you decide to save your own data.
Import broker exports and common file formats, review the rows first, and report missing ticker or ISIN data when something needs attention.
Open research and calculation tools before deciding whether to create an account.
Portfolio, dividend, forecast, DRIP, and import screens are shown below.
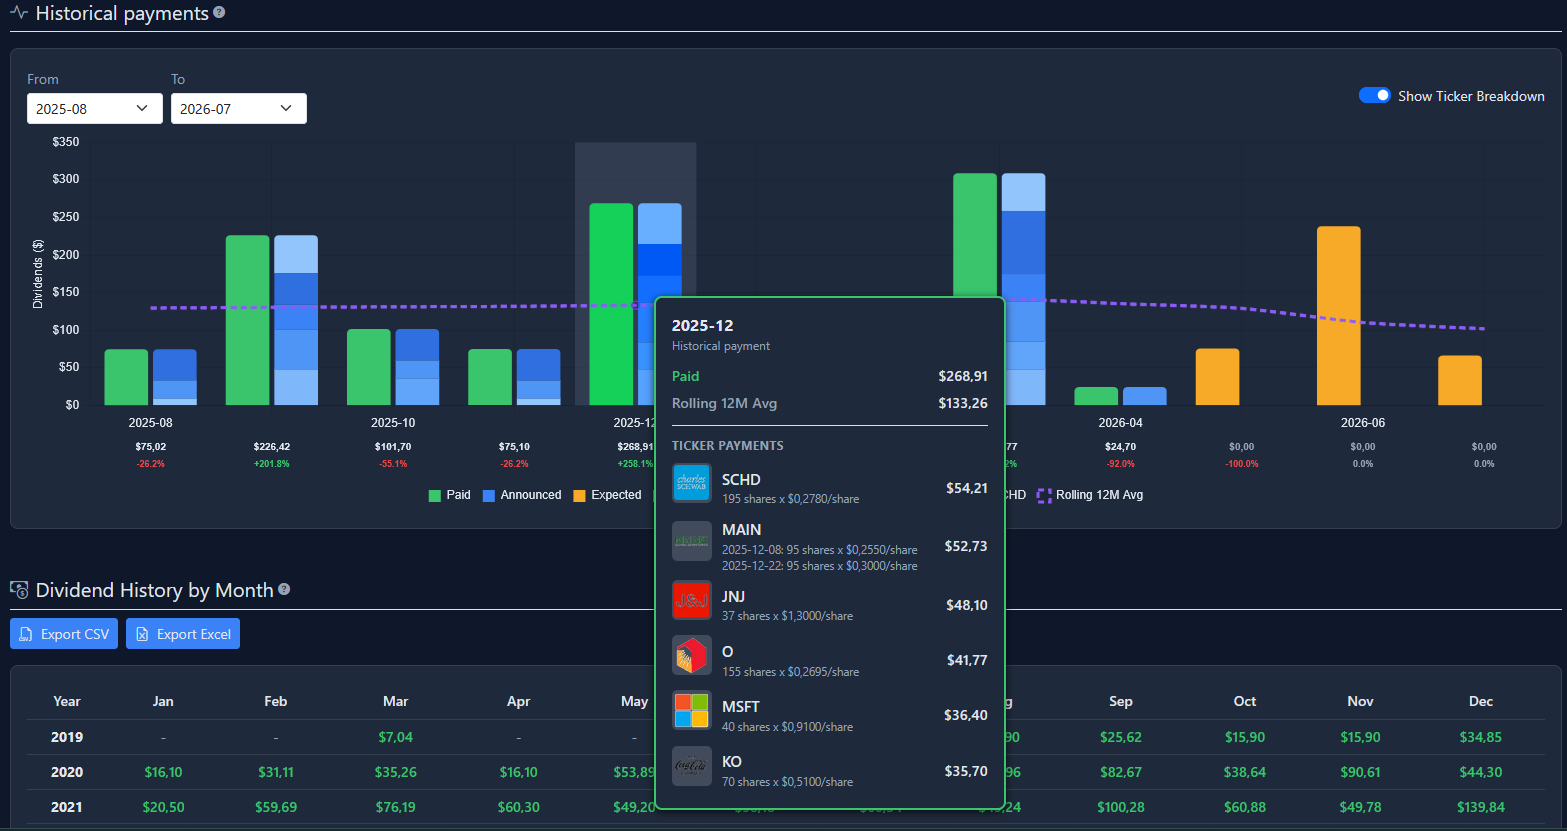
Keep an eye on dividend income with pages built around payments, projections, and payout history.
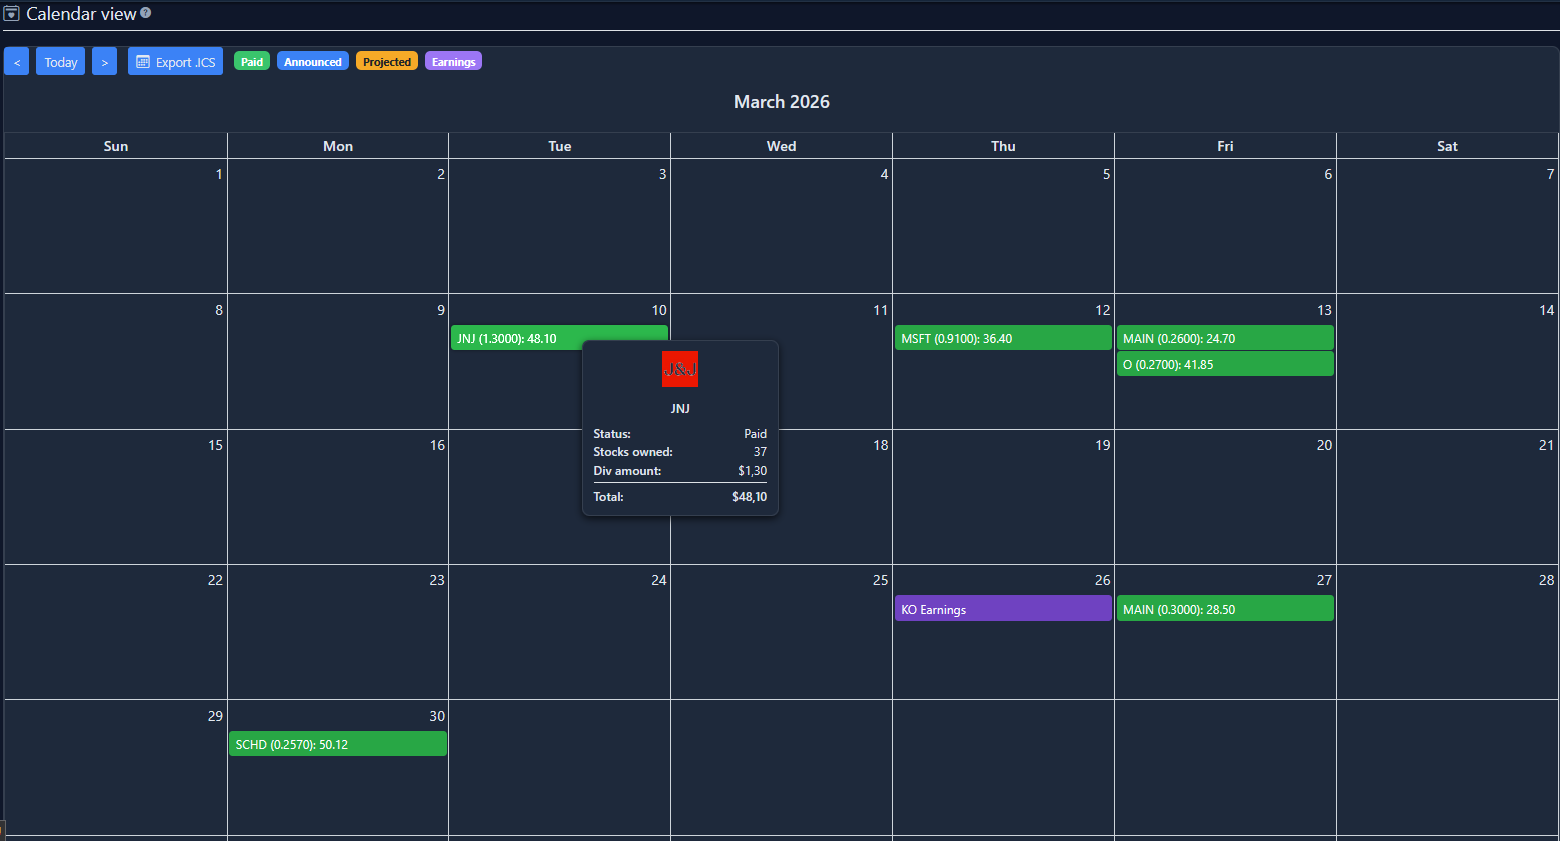
Check upcoming dividends and earnings in an easy-to-scan calendar view, and download events as an ICS file for your personal calendar.
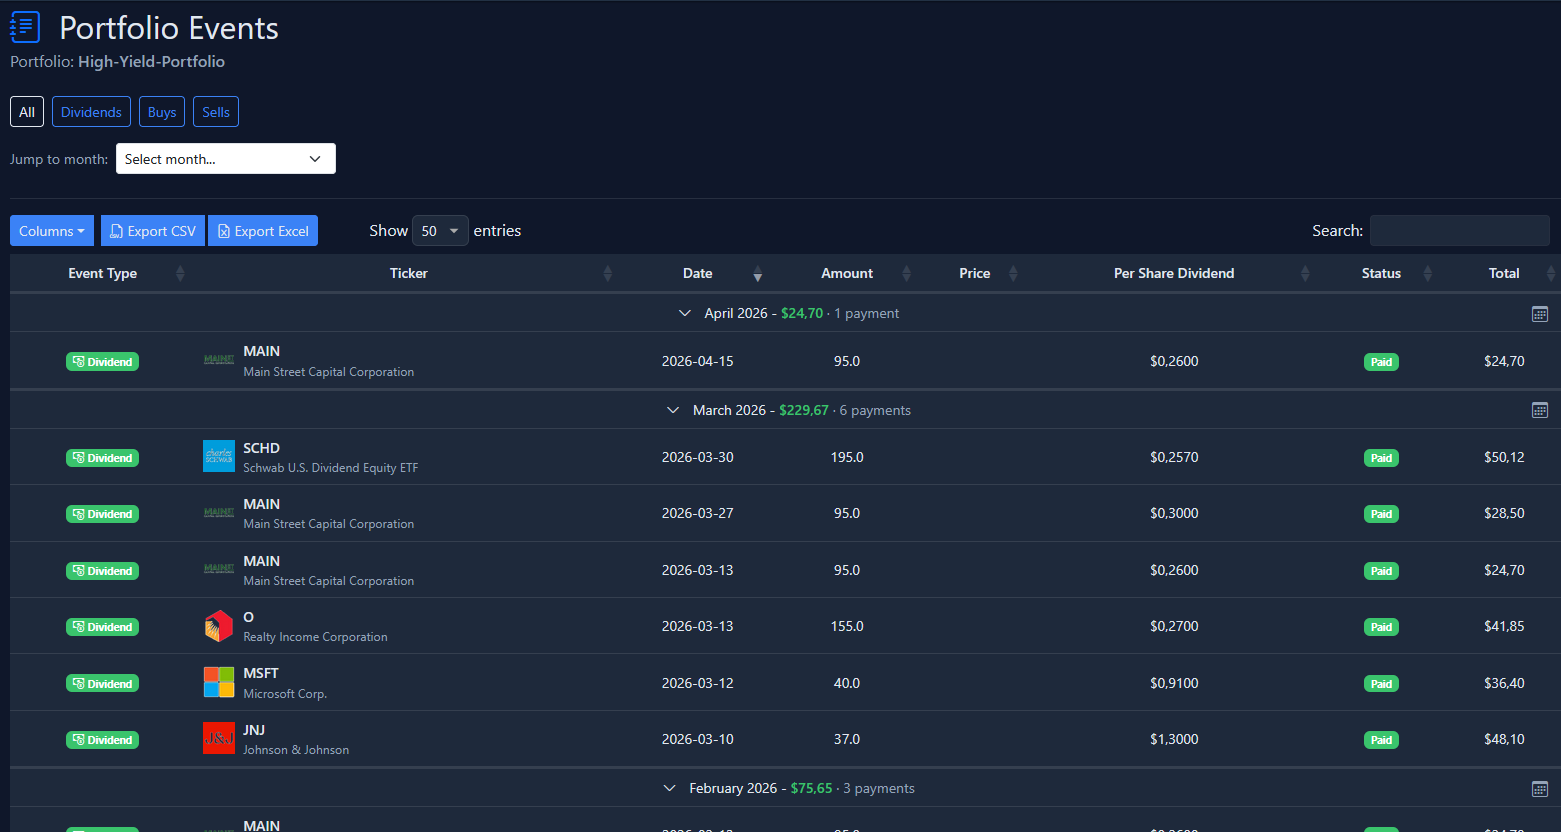
See portfolio activity and income-related milestones in one timeline.
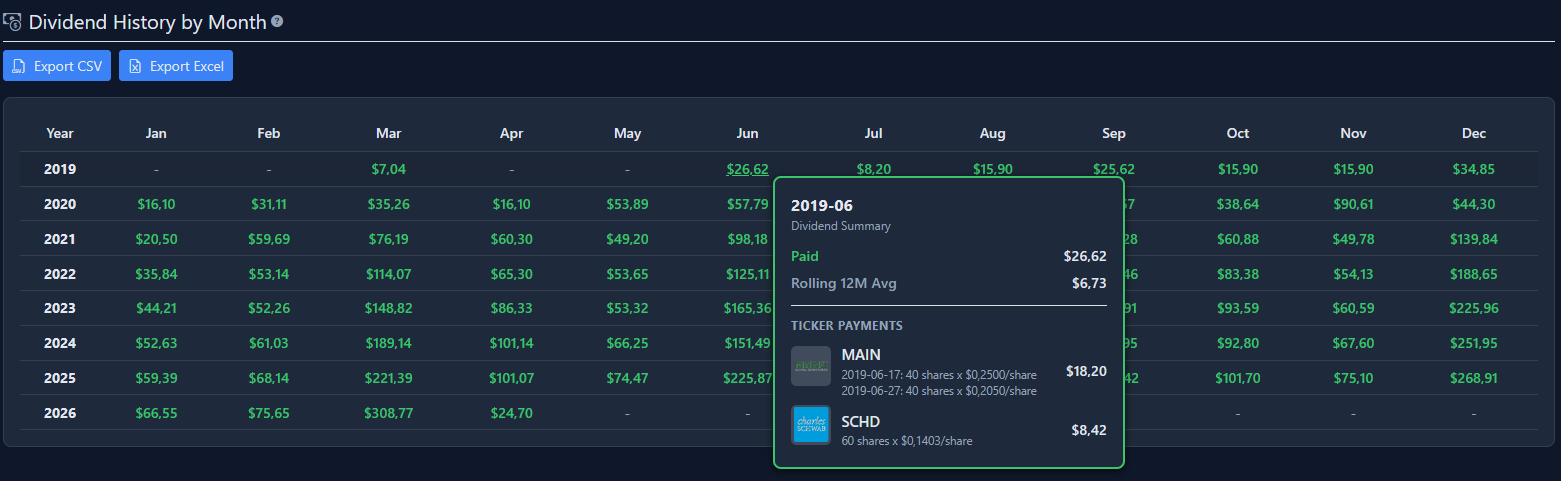
Scan monthly income by year, export the table, and open payment details for each month.
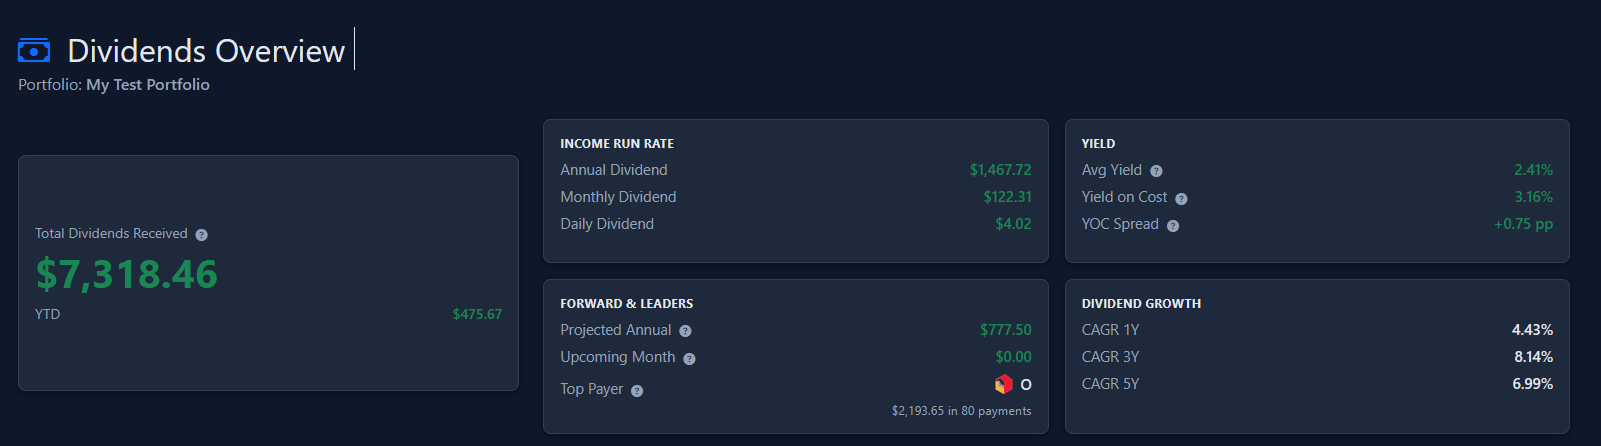
Review income, yield, top payer, projections, and dividend growth in one focused overview.
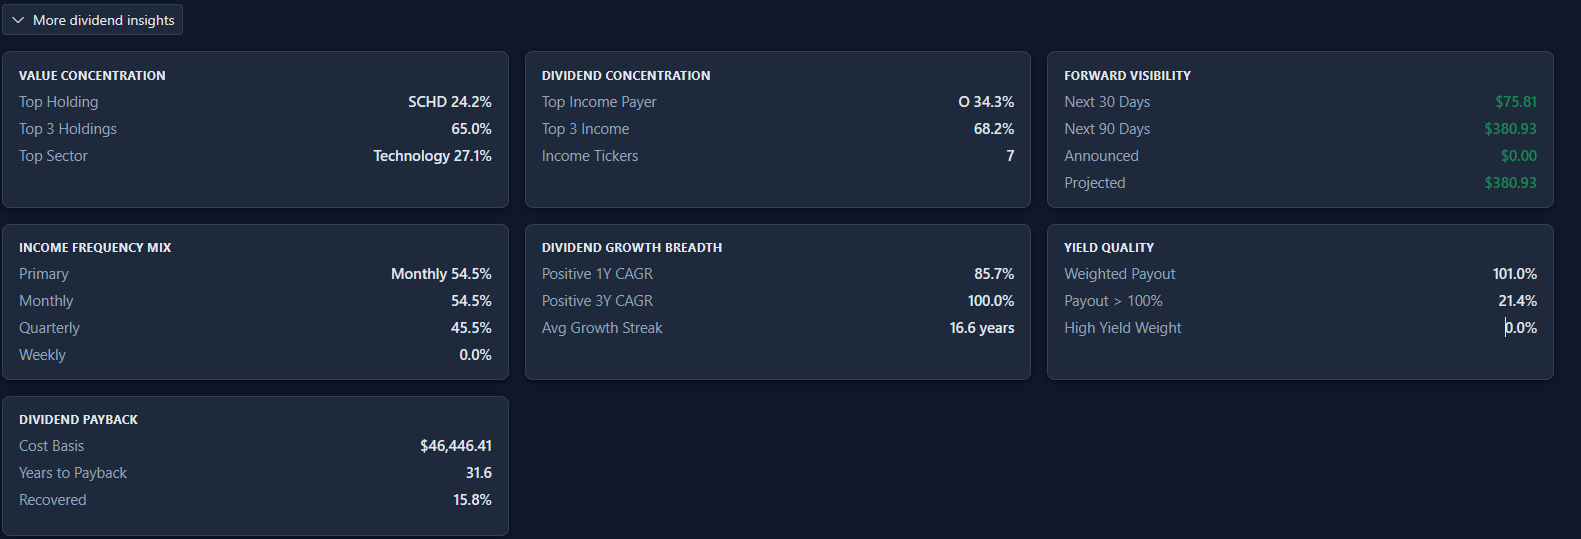
Expand extra KPI blocks for income quality, cadence, concentration, and coverage without crowding the overview.
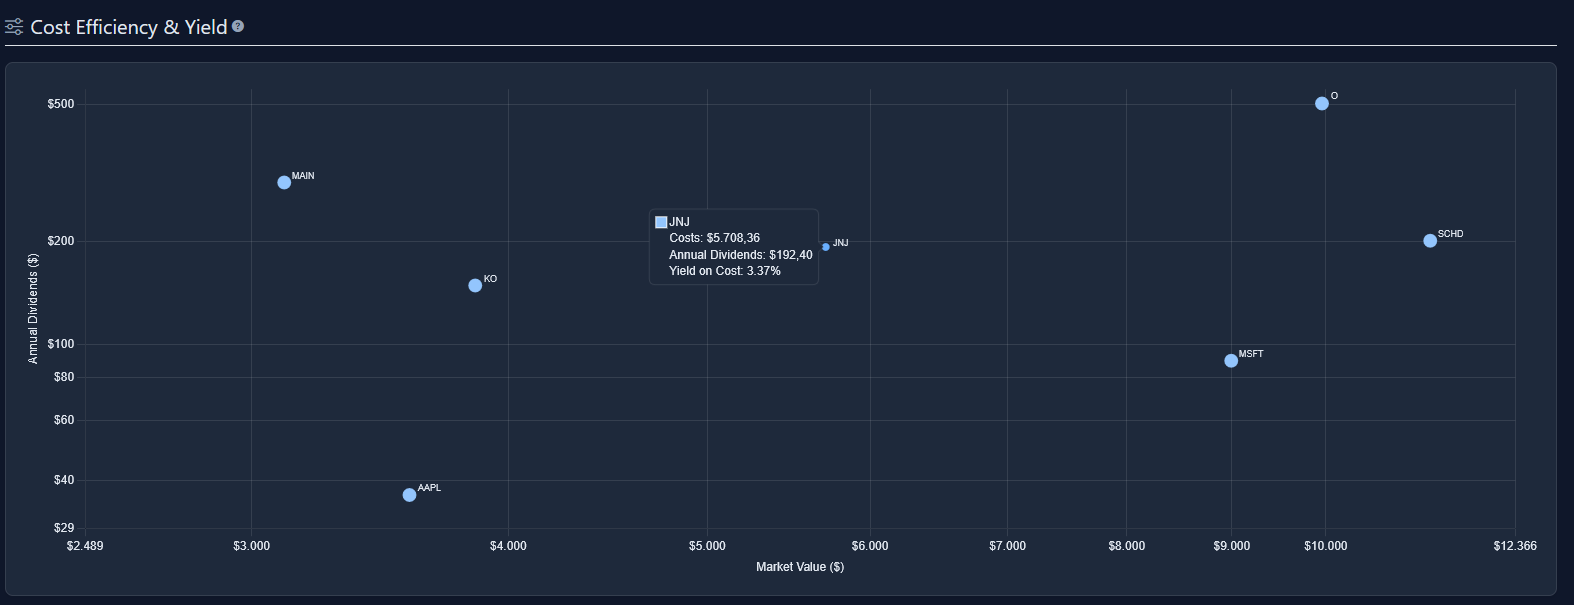
Compare current yield, yield on cost, and cost-efficiency views so dividend quality is easier to judge.
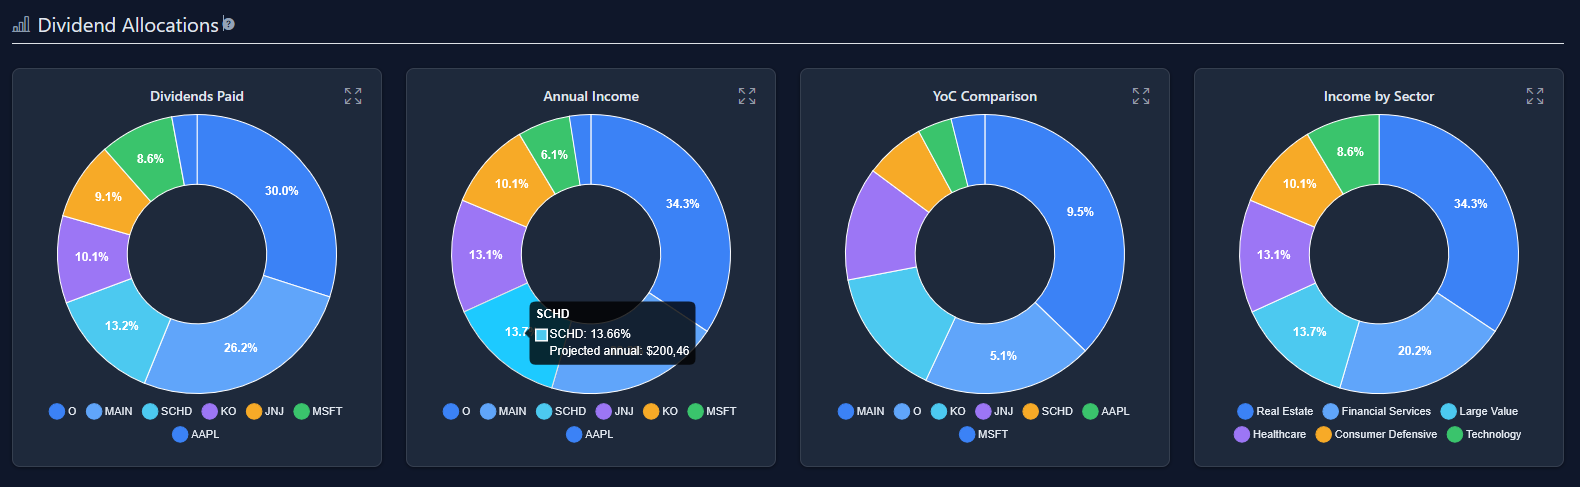
Use dividend and portfolio allocation views to understand concentration across sectors, tickers, and positions.
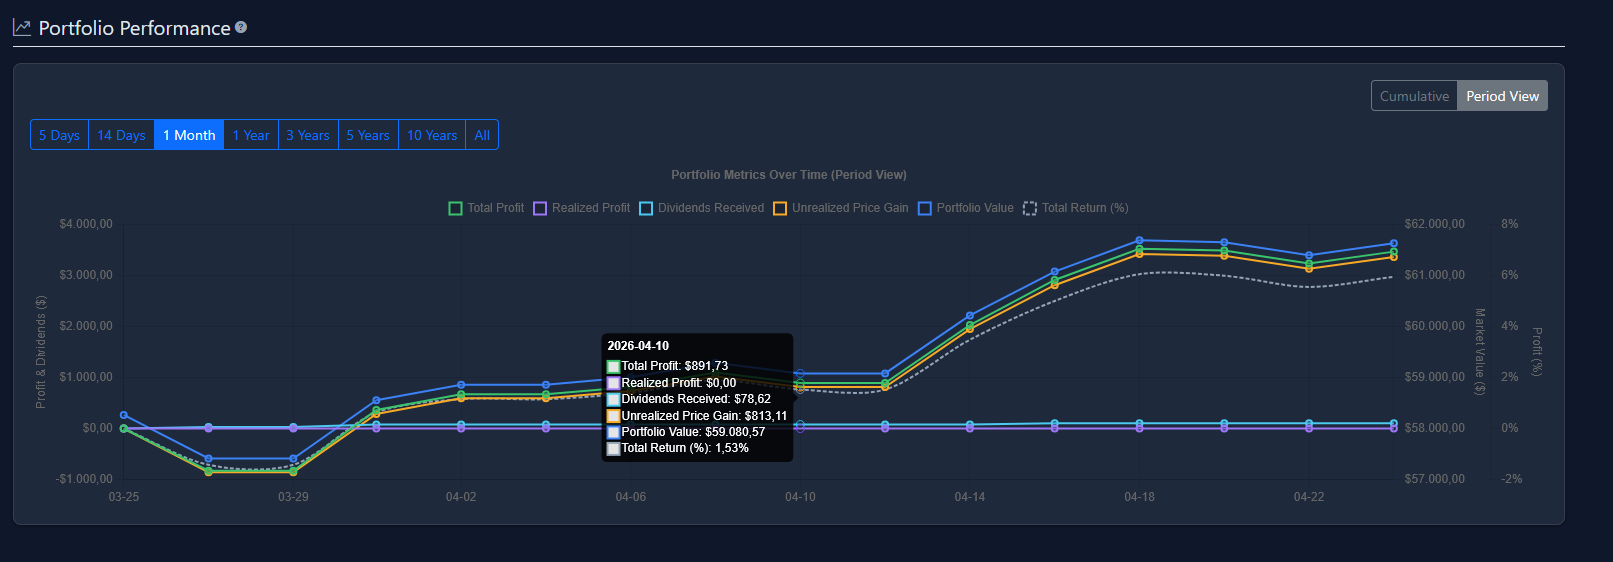
See market value, total return, dividends, and allocation together in one clear overview.
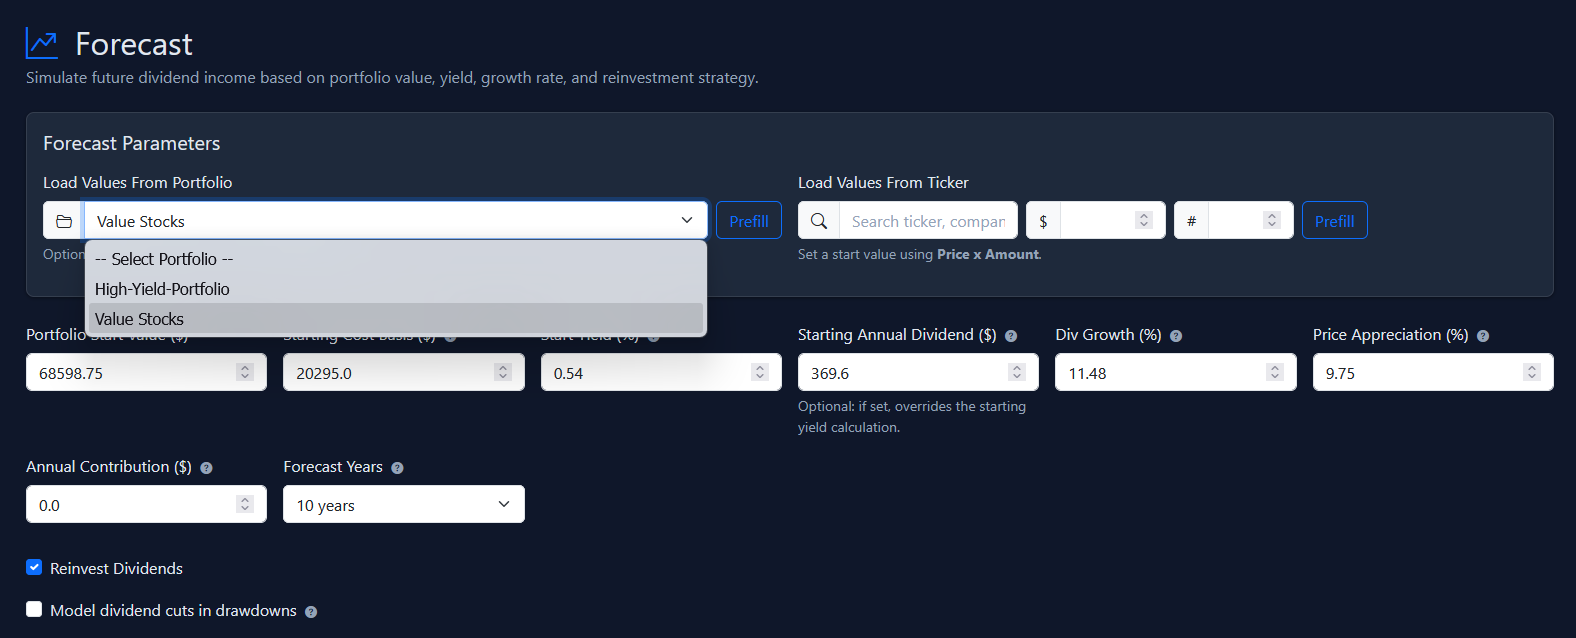
Start with one of your own portfolios and test stock value, dividend income, and reinvestment assumptions.
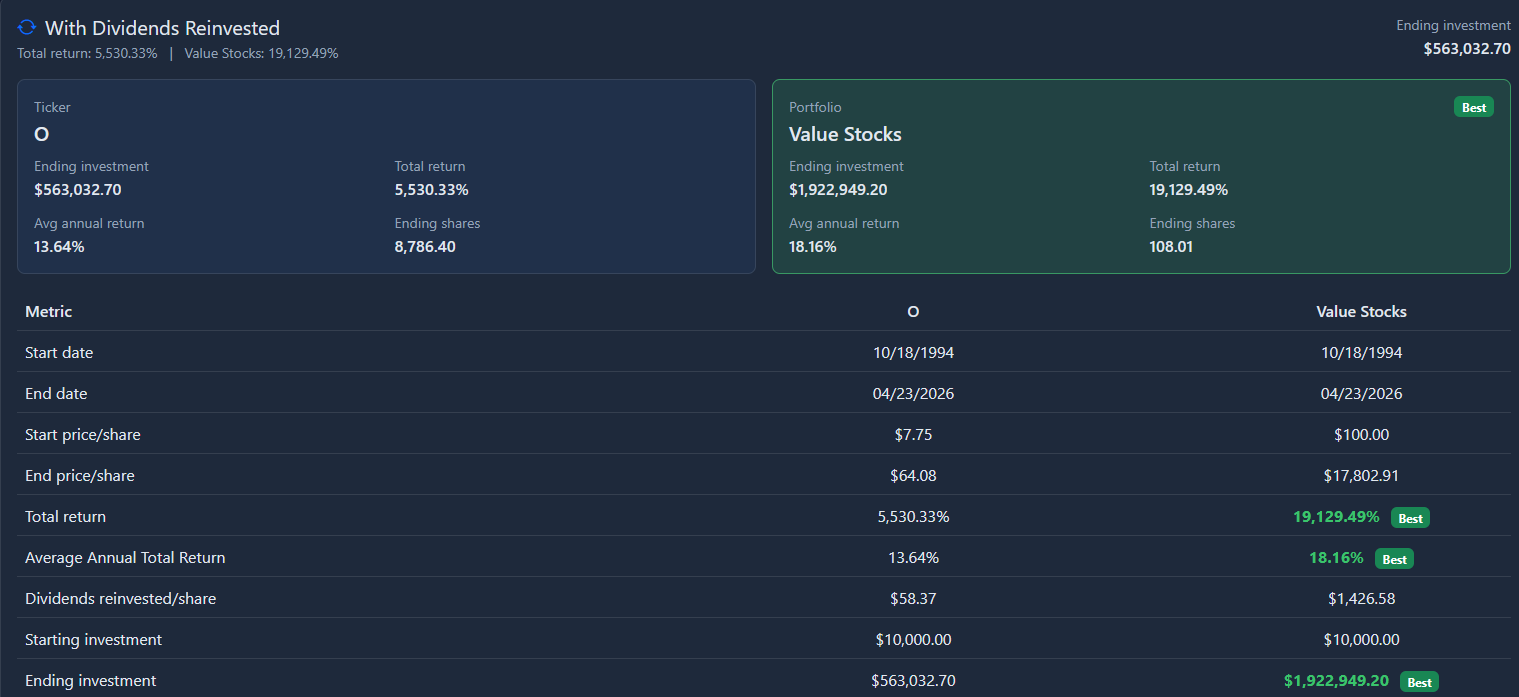
Compare reinvested and non-reinvested results for one stock, stock versus stock, or stock versus portfolio scenarios.
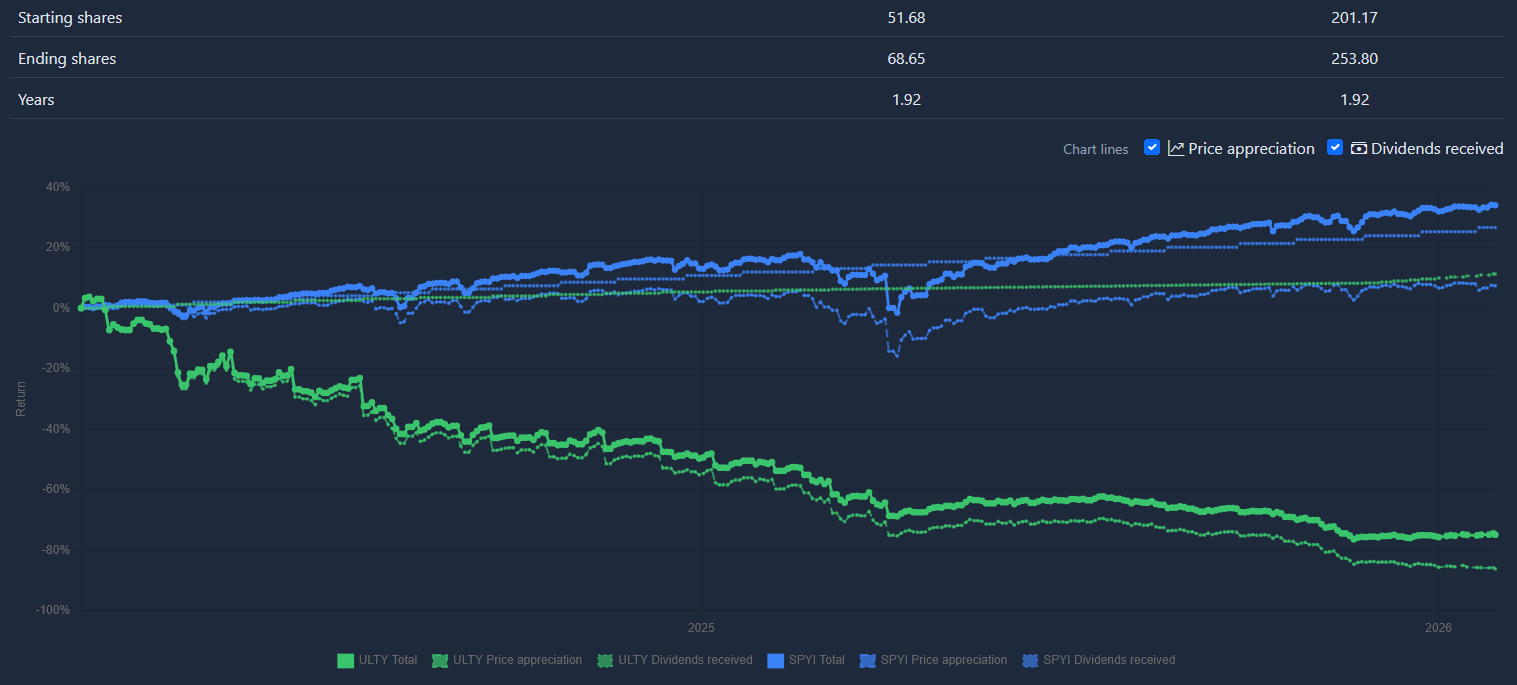
The chart view makes it easier to see how both tickers separate over time with and without reinvestment.
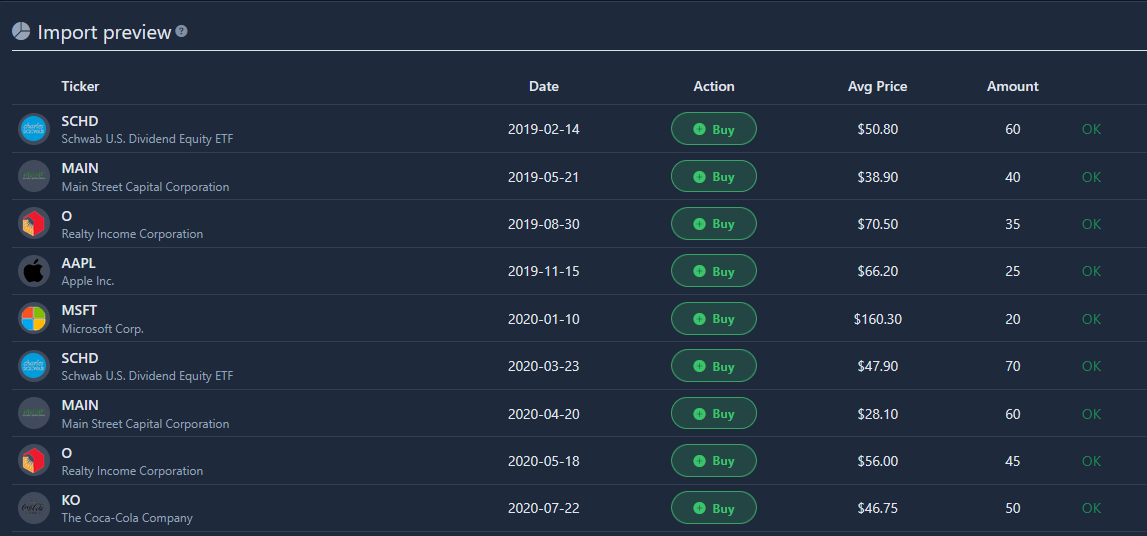
Review imported rows before saving, with support for multiple broker platforms and file formats.